Filters
Three controls at the top of the page shape the data you see:- Region scope (left): Toggle between All DACH region and any specific office/region you have access to. The scope you pick drives both the chart and the table below.
- Country multi-select (right): Narrow the view to Germany, Austria, Switzerland, or any combination of them. Defaults to all three.
- Registration dates (above the table): A calendar range picker that limits the table to organizations whose registration date falls within the chosen window. By default, the table opens on the latest available date so you immediately see what’s brand new. Click Reset to latest to jump back to today after exploring an earlier window.
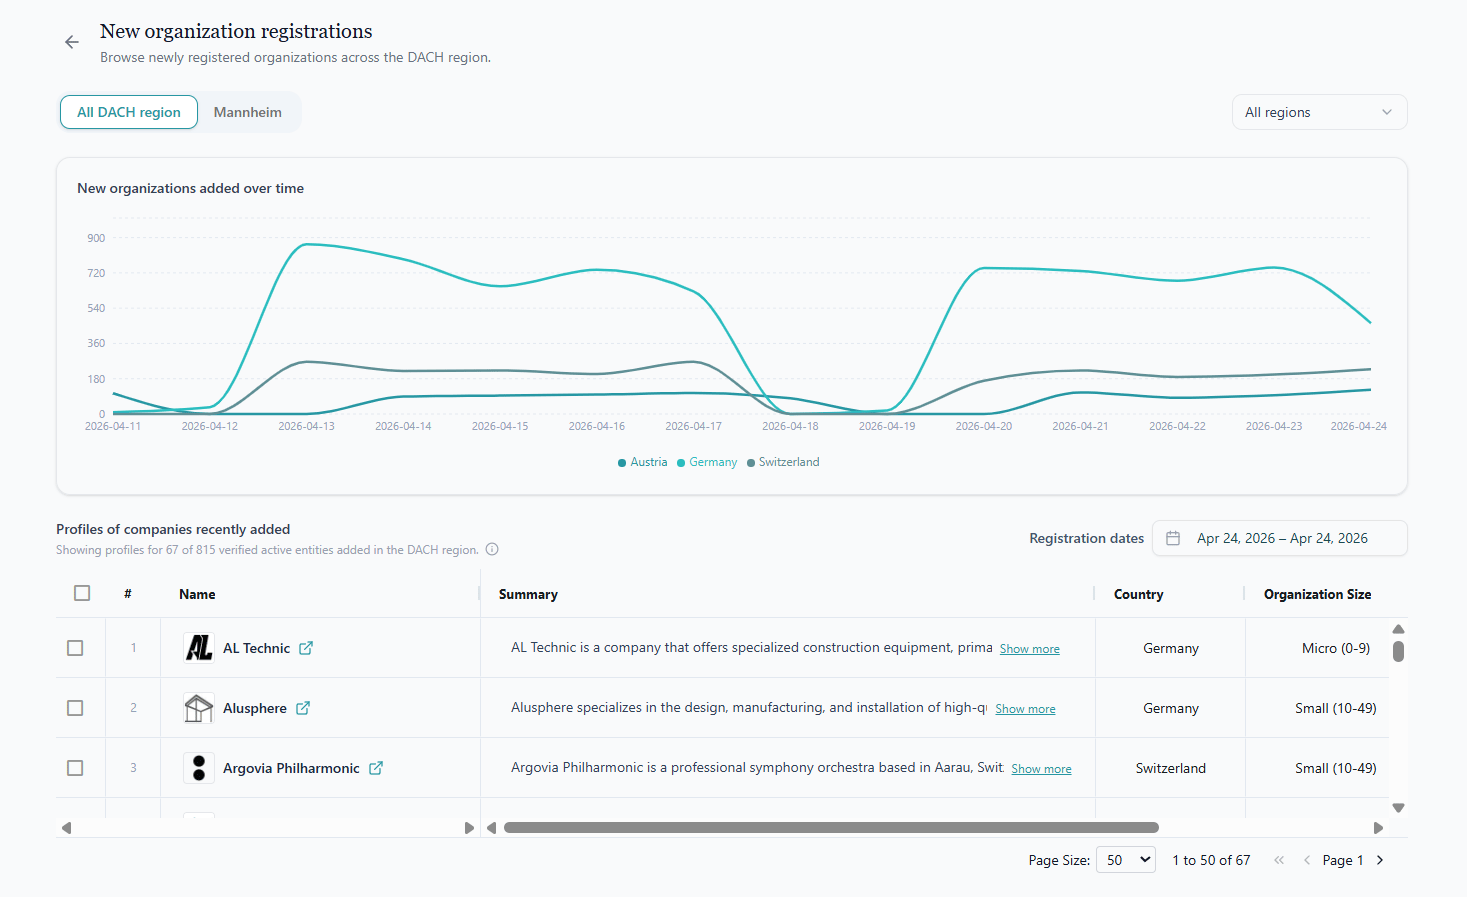
New organizations added over time
The line chart plots how many new organizations have been registered each day, with a separate line per country (Germany, Austria, Switzerland). Hover over any point to see the exact count for that day. Use this chart to:- Spot registration trends or anomalies.
- Compare activity across countries.
- Pick a day or period worth drilling into with the table below.
Profiles of organizations recently added
Below the chart, a paginated table shows the actual newly registered organizations. The summary line above the table (for example, “Showing profiles for 72 of 863 verified active entities added in the DACH region”) indicates:- Total processed: organizations detected in the register for the selected scope and date range.
- Profiles built: of those, how many have a verified active web domain so we can show a full profile.